Client Satisfaction Metrics: Measuring Cleanliness Success

Why Metrics Matter for Cleaning Services
Measurable data builds client trust by turning subjective impressions of cleanliness into transparent, repeatable results. When Bravo Cleaning publishes CSAT, NPS, audit scores and eco‑friendly usage rates, property managers see exactly how service standards are met, reducing uncertainty and encouraging longer contracts. A data‑driven culture starts with regular post‑service surveys, ATP testing, and digital checklists that feed real‑time dashboards for supervisors and cleaners alike. By reviewing these metrics weekly, Bravo identifies trends—such as slower response times or lower scores on equipment cleanliness—and implements targeted training, schedule adjustments, or product changes. The result is a continuous loop where numbers guide concrete improvements, leading to higher satisfaction scores, stronger retention, and a reputation for reliable, customized cleaning solutions.
Key Cleaning Industry Satisfaction & KPI Facts
- Fuzzy conjoint analysis of a 7‑point Likert survey showed higher agreement levels than traditional mean scores, moving most items to 'agree' or 'somewhat agree' categories.
- In a study of 30 university students, the questionnaire achieved a Cronbach’s alpha of 0.751, indicating acceptable internal consistency.
- Cleaning companies that consistently achieve CSAT scores of 8‑10 on a 1‑10 scale report client retention rates of 85‑95 %.
- Net Promoter Scores (NPS) of 50 or higher are considered excellent in the cleaning industry; Bravo Cleaning records NPS values above 60.
- Eco‑friendly cleaning products can boost customer satisfaction by up to 15 % among environmentally conscious clients.
- Visual inspection checklists using a 5‑point rating aim for a 95 % pass‑rate as a benchmark for high‑quality service.
- ATP bioluminescence testing targets readings below 30 RLU for non‑critical areas; a 90 % ATP pass‑rate correlates with higher client satisfaction.
- The 3‑30 rule schedules three separate 30‑minute cleaning sessions daily, totaling about 90 minutes, to maintain consistent tidiness.
- The 1 % rule allocates roughly 10‑15 minutes per day to a specific cleaning task, helping prevent large‑scale cleaning marathons.
- Typical annual turnover in the commercial cleaning sector ranges from 20 % to 30 %, and high turnover negatively impacts service consistency and satisfaction scores.
1. Fuzzy Conjoint Analysis Shows Higher Satisfaction Than Mean Scores

The Study published in PLOS ONE on September 1 2021 (vol 16, issue 9, e0256896) applied fuzzy conjoint analysis to a 7‑point Likert questionnaire that asked 30 university students to rate seven cleanliness attributes of food premises: overall store cleanliness, utensil and equipment hygiene, food‑handler attire, sneezing or coughing behavior, presence of pests, smoking by handlers, and whether food was well covered. The pilot test achieved a Cronbach’s alpha of 0.751, confirming acceptable internal consistency. When traditional mean‑based analysis was used, many items fell into neutral or low‑satisfaction zones. By contrast, the fuzzy conjoint approach translated the same responses into higher agreement levels—most items were rated “agree” or “somewhat agree.” This shift indicates that fuzzy logic captures nuanced customer sentiment that average scores obscure, revealing a more accurate picture of client happiness with cleanliness. Consequently, the authors concluded that fuzzy conjoint analysis is a viable alternative for measuring satisfaction in service environments, especially where subtle quality cues matter.
2. Client Satisfaction Scores and Retention Linked to 1‑10 Ratings

Cleaning companies typically capture client satisfaction through post‑service surveys that ask customers to rate their experience on a 1‑5 or 1‑10 scale. The resulting figure is called a Customer Satisfaction Score (CSAT). In a 1‑10 format, ratings of 8‑10 are classified as "satisfied," and the percentage of such responses becomes the CSAT metric that directly reflects perceived cleanliness, timeliness, and staff professionalism.
Research across the industry shows a strong correlation between high CSAT and client retention. Companies that consistently achieve CSAT scores of 8‑10 report annual retention rates of 85‑95 %, whereas firms with lower scores (below 7) often fall into the 70‑80 % retention band. This link is reinforced by studies that link a 5‑point increase in CSAT to a 20 % boost in repeat bookings.
Bravo Cleaning, for example, maintains a 4.8‑out‑of‑5 rating on Google and a 5‑star average on Angi, translating into an estimated 87 % client‑retention rate—well above the industry average. By publishing real‑time CSAT dashboards and responding to feedback within 4 hours, the company demonstrates how transparent scoring drives loyalty and supports eco‑friendly, customized cleaning solutions for property managers and business clients.
3. Net Promoter Score (NPS) as a Loyalty Indicator

The Net Promoter Score (NPS) gauges client loyalty by asking customers how likely they are to recommend a cleaning service on a 0‑10 scale. Scores of 9‑10 are classified as promoters, 7‑8 as passives, and 0‑6 as detractors. In the cleaning industry, an NPS of 50 or higher is considered excellent, signaling strong word‑of‑mouth potential and high retention. Bravo Cleaning consistently records NPS values above 60, a result of its reliable crews, eco‑friendly practices, and customized turnover and carpet‑care solutions. These high scores translate into a steady stream of referrals, reinforcing the company’s market position in Minneapolis and beyond.
What is the best KPI for measuring customer satisfaction? While NPS captures long‑term loyalty, the most direct KPI for immediate satisfaction is the Customer Satisfaction Score (CSAT). CSAT measures a client’s reaction to a specific service interaction—typically via a short post‑service survey—providing actionable feedback that can be acted on quickly to improve service quality and client happiness.
4. Eco‑Friendly Practices Boost Satisfaction by Up to 15 %

Property managers and business clients are increasingly demanding cleaning solutions that are both effective and environmentally responsible. A 2022 survey found that 68 % of residential clients prefer cleaning‑friendly products, and this preference translates directly into higher perceived cleanliness. The "fresh" dimension of the Cleanliness Perceptions Scale—encompassing odor control and the absence of chemical residues—is especially enhanced when biodegradable, low‑VOC cleaners are used.
Companies that track green‑product usage as a percentage of total cleaning agents and monitor waste‑reduction rates can demonstrate tangible sustainability performance. For example, reporting that 85 % of the products applied are eco‑certified and that landfill waste from consumables has fallen 20 % year‑over‑year provides clear, data‑driven evidence of commitment to green cleaning.
How can cleaning businesses differentiate with eco‑friendly options? By offering biodegradable, low‑VOC products and transparently reporting green‑product usage and waste‑reduction rates, firms improve the "fresh" dimension of perceived cleanliness. This approach not only meets the 68 % client demand but also drives up to a 15 % increase in satisfaction among environmentally conscious customers, strengthening loyalty and referrals.
5. Quality Audits and ATP Testing Provide Objective Cleanliness Data

Effective cleaning programs rely on both visual and laboratory‑based verification to demonstrate true hygiene.
Visual inspection checklists with a 5‑point rating – Facility managers use standardized checklists that score each surface (floors, restrooms, high‑touch areas) on a scale from 1 (poor) to 5 (excellent). This method captures the "cleaned" and "uncluttered" dimensions of perceived cleanliness and provides an immediate, quantifiable audit score. A 95 % pass‑rate on these checklists is widely recognized as a benchmark for high‑quality service.
ATP bioluminescence testing – target < 30 RLU for non‑critical areas – ATP meters detect residual organic matter, translating light output into relative light units (RLU). Scores below 30 RLU indicate a surface that meets stringent cleanliness standards, aligning with the "fresh" dimension of the Cleanliness Perceptions Scale. Industry data shows that achieving a 90 % ATP pass‑rate (≤ 30 RLU) correlates with higher client satisfaction scores and lower complaint volumes.
Putting the metrics together – By coupling the 5‑point visual audit with ATP results, cleaning firms can present a dual‑layered performance dashboard: a 95 % visual pass‑rate and a 90 % ATP pass‑rate. This objective evidence supports post‑service surveys, drives continuous improvement, and reinforces eco‑friendly practices that reduce chemical residues.
How do you measure the effectiveness of cleaning? Effectiveness is measured through spot‑checks and before‑after photos, quantitative ATP tests that detect organic residue, chemical‑residue analysis, and client satisfaction surveys that confirm perceived cleanliness.
How to Gain Clients as a Cleaner?

Define target market and service offerings – Identify the segments you serve (e.g., residential turnover, commercial offices, condo associations) and tailor packages such as deep‑clean, eco‑friendly, or customized schedules.
Professional website and clear service pages – A clean, mobile‑friendly site that lists each service, pricing tiers, and the benefits of green products builds credibility.
Customer testimonials and social proof – Showcase 5‑star reviews, Google ratings (e.g., Bravo Cleaning’s 4.6/5), and quotes that mention reliability, thoroughness, and fresh scents.
Before‑and‑after photos on social media – Visual proof of “cleaned, fresh, uncluttered” results reinforces the Cleanliness Perceptions Scale dimensions and attracts clicks.
Local online advertising (Google Ads, Facebook) – Target geo‑specific keywords like “Minneapolis turnover cleaning” and use geo‑based offers.
Networking with property managers and real‑estate agents – Attend facility‑management meetings, share audit checklists, and offer free trial cleanings to demonstrate quality.
First‑time‑client discounts and referral incentives – A 10 % discount or a “refer a friend” credit encourages trial and word‑of‑mouth.
Chamber of commerce and community group participation – Sponsor local events, publish sustainability reports, and leverage community roots to differentiate.
Eco‑friendly cleaning options – Highlight biodegradable products and reduced chemical waste; studies show a 15 % lift in satisfaction among green‑conscious clients.
Consistent, reliable service – Assign the same cleaner to each location, meet response‑time targets (≤4 hours for inquiries, ≤2 hours for emergencies), and maintain audit scores ≥95 %; consistency drives repeat bookings and high retention rates.
What is the 3‑30 Rule for Cleaning?

The 3‑30 rule is a time‑blocking method that schedules three separate 30‑minute cleaning sessions each day. By tackling distinct areas—such as the kitchen, bathroom, and floor surfaces—in short, focused intervals, you keep a property consistently tidy, avoid overwhelming chores, and fit cleaning into a busy schedule. The total of an hour and a half daily (≈90 minutes) maintains health, safety, and organization. Each session lasts about 30 minutes, allowing staff to concentrate on high‑impact tasks while using eco‑friendly products that reduce chemical exposure and support sustainability goals. Applying the rule prevents the buildup of dirt and grime, which in turn lowers the need for intensive deep‑cleaning later and improves client satisfaction. Property managers who adopt the 3‑30 rule report higher audit scores and fewer complaints, as regular micro‑cleaning keeps spaces “cleaned,” “fresh,” and “uncluttered” according to the Cleanliness Perceptions Scale.
Client Satisfaction Metrics – Cleaning Examples

Cleaning companies rely on a set of clear, data‑driven metrics to demonstrate service quality and build client trust.
Score
- ** / post‑service surveys** – After each job, clients rate their experience on a 1‑5 or 1‑10 scale. The resulting Customer Satisfaction Score (CSAT) provides a quick snapshot of perceived cleanliness, timeliness, and professionalism.
- Net Promoter Score (NPS) – Clients answer, “On a scale of 0‑10, how likely are you to recommend our service?” Scores above 50 are considered excellent in the industry and signal strong loyalty.
- Repeat‑job rate – The percentage of customers who schedule a second or recurring cleaning reflects satisfaction and confidence in consistent performance.
- On‑time completion percentage – Tracking how often crews finish within the agreed window (e.g., 95% of jobs on schedule) links reliability to higher CSAT scores.
- Complaint‑resolution time – Measuring the average time to address a client issue (target < 4 hours for non‑emergencies) shows responsiveness and helps retain customers.
- Cleanliness‑inspection pass rate – Systematic audits using checklists or ATP testing yield a pass‑rate (often ≥ 95%) that directly correlates with client‑reported cleanliness satisfaction.
Together, these metrics give property managers and business clients a transparent, quantitative view of cleaning performance, reinforcing eco‑friendly practices and consistent staffing, and the tailored solutions that Bravo Cleaning and similar firms deliver.
5 Ways to Measure Customer Satisfaction

- Post‑service CSAT surveys – Send a brief 1‑5 Likert questionnaire within 24 hours of job completion. Industry data shows CSAT scores below 7 on a 1‑10 scale flag service gaps, while scores above 4.5/5 correlate with repeat bookings.
- Net Promoter Score (NPS) – Ask clients how likely they are to recommend Bravo Cleaning on a 0‑10 scale; scores above 50 are considered excellent in the cleaning sector and predict future growth.
- Online review monitoring – Track ratings on Google, Yelp, and Angi. A 4.6‑star average (as reported by Bravo Cleaning) drives a 12‑% boost in new client inquiries and validates service quality.
- Repeat‑client percentage – Calculate the proportion of customers who schedule another cleaning within 6 months; rates above 70 % signal strong loyalty and align with the industry‑average retention of 85‑95 % for high‑performing teams.
- Complaint‑resolution time and follow‑up feedback – Measure the interval from complaint receipt to resolution (target < 4 hours) and capture post‑resolution satisfaction; fast resolution improves overall CSAT by up to 10 % and reduces churn.
Together, these metrics give property managers a data‑driven view of service performance and help Bravo Cleaning continuously refine its eco‑friendly, customized cleaning solutions.
10 Key Customer Satisfaction Measures

Property managers and business clients rely on a concise set of performance indicators to gauge how cleaning services meet expectations. The most widely recognized metrics include:
- Customer Satisfaction Score (CSAT) – a post‑service survey rating (typically 1‑5 or 1‑10) that captures immediate client impressions of cleanliness, timeliness and professionalism. Scores above 7/10 signal strong satisfaction (Performance Metrics, 2023).
- Net Promoter Score (NPS) – asks customers how likely they are to recommend the service on a 0‑10 scale; scores above 50 are considered excellent in the cleaning industry (Moxo, 2024).
- Customer Effort Score (CES) – measures the ease of scheduling or contacting the provider; lower effort correlates with higher loyalty (Moxo, 2024).
- First‑response time – the interval between a client inquiry and the initial reply; responses within 4 hours boost satisfaction (Performance Metrics, 2024).
- First‑contact resolution (FCR) rate – percentage of issues resolved on the first interaction; rates above 80 % drive higher CSAT (Moxo, 2024).
- On‑time job completion – percentage of jobs finished by the agreed deadline; consistent punctuality improves trust (Janitorial Manager, 2023).
- Repeat‑business rate – proportion of clients who re‑book services; rates above 80 % indicate strong retention (Top10 KPIs, 2023).
- Complaint‑resolution time – speed of addressing complaints; resolving within 24 hours reduces churn (Performance Metrics, 2024).
- Online review rating average – aggregated star rating from platforms such as Google or Angi; a 4.5‑5.0 average reflects high perceived quality (Bravo Cleaning Reviews, 2023).
- Service‑quality inspection pass rate – audit score from visual checklists or ATP testing; pass rates of 95 %+ are linked to higher client happiness (ISSA, 2023).
A final pillar is employee‑training compliance rate, tracking completion of SOP certification; higher compliance lifts CSAT by 15‑20 % (ISSA, 2023). Together, these ten measures provide a comprehensive, data‑driven view of client satisfaction, guiding continuous improvement and reinforcing the credibility of cleaning providers such as Bravo Cleaning.
How Do You Measure the Effectiveness of Cleaning?

Effectiveness is measured through a blend of objective inspections and client‑focused feedback.
Visual spot‑checks and before‑after photos – Trained supervisors conduct on‑site spot‑checks and capture before‑and‑after images to verify that high‑traffic surfaces, restrooms, and entryways meet visual cleanliness standards.
ATP bioluminescence testing – Portable ATP meters quantify organic residue on surfaces; readings below 30 RLU (relative light units) are considered clean for most commercial environments, providing a rapid, data‑driven benchmark.
CFU microbial counts – Swab samples are cultured to determine colony‑forming units per square centimeter, allowing facilities to confirm that bacterial loads stay under industry‑defined thresholds.
Chemical residue analysis – Post‑cleaning wipe tests verify that disinfectant residues are within safe limits, protecting occupants from irritation while confirming proper product dilution.
Client satisfaction surveys – Short, Likert‑scale surveys (e.g., CSAT 1‑5 or 1‑10) are sent within 24 hours of service completion; scores of 4 or higher and follow‑up comments on “cleaned,” “fresh,” and “uncluttered” dimensions serve as direct indicators of perceived quality.
Compliance audits against standards – Regular audits reference ISSA Clean Standard, ISO 45001, and local health codes; audit scores of 95 % or above demonstrate adherence to contractual and regulatory expectations.
Combining these quantitative metrics with qualitative client feedback creates a comprehensive dashboard that drives continuous improvement, supports eco‑friendly practices, and reinforces the trust property managers and business clients place in cleaning cleaning services.
What is the 5‑Point Customer Satisfaction Scale?

The 5‑point customer satisfaction scale is a Likert‑type rating that asks respondents to evaluate their experience on a five‑step continuum: 1 = Very Dissatisfied, 2 = Dissatisfied, 3 = Neutral, 4 = Satisfied, and 5 = Very Satisfied. In most cleaning‑service surveys, scores of 4 and 5 are classified as “satisfied” responses. To calculate a CSAT (Customer Satisfaction Score) percentage, count the number of satisfied responses, divide by the total number of survey completions, and multiply by 100. For example, if 80 out of 100 respondents select 4 or 5, the CSAT is 80 %. This simple metric provides a quick, quantitative snapshot of client happiness and is widely used across the cleaning industry—from post‑service surveys at Bravo Cleaning to academic studies on food‑premise hygiene—allowing property managers and business clients to track service quality, identify improvement areas, and benchmark performance against industry standards.
What is the 1 % Rule of Cleaning?

The 1 % rule means allocating roughly 1 % of your day—about 10‑15 minutes—to a specific cleaning task such as a countertop, a floor section, or a high‑traffic doorway. By dedicating this short, focused period each day, you avoid the need for large‑scale cleaning marathons and keep the environment consistently tidy. The rule emphasizes a single, manageable task per session, which makes it easy to start and sustain. Over weeks and months, these brief actions compound, delivering a noticeable improvement in overall cleanliness while reinforcing a habit that staff and residents can adopt effortlessly. For property managers, applying the 1 % rule across units or common areas creates a predictable, low‑effort maintenance rhythm that supports higher client satisfaction and reduces the likelihood of major complaints.
The 5 Key CX Metrics

Property managers and business clients rely on five core customer‑experience (CX) metrics to gauge cleaning‑service performance. Net Promoter Score (NPS) measures loyalty by asking how likely customers are to recommend the service; scores above 50 are considered excellent in the cleaning sector. Customer Satisfaction Score (CSAT) captures immediate post‑service sentiment on a 1‑5 or 1‑10 scale, with higher averages indicating perceived cleanliness, timeliness, and professionalism. Customer Effort Score (CES) assesses how easy it is for clients to schedule, request changes, or resolve issues—fewer steps boost CES and reduce churn. Customer churn rate tracks the proportion of contracts not renewed; a low churn (under 12 % annually) signals strong satisfaction and retention. First‑Contact Resolution (FCR) records the percentage of inquiries or complaints solved on the first interaction; rates above 80 % correlate with higher CSAT and repeat business. Together, these metrics provide a data‑driven roadmap for maintaining eco‑friendly, reliable, and tailored cleaning solutions.
What Are the 3 C’s of Customer Satisfaction?

The 3 C’s of customer satisfaction in the cleaning industry are Commitment, Communication, and Consistency. Commitment means delivering reliable, high‑quality service every time—Bravo Cleaning, for example, emphasizes experienced staff, eco‑friendly practices and a 20‑year track record of on‑time, thorough cleanings that earn repeat‑business rates above 70 %. Communication covers clear, timely interaction with clients, from fast response times (often within 4 hours for inquiries) to post‑service surveys that capture specific feedback on cleanliness, timeliness and professionalism. Consistency ensures a uniform experience across all touchpoints, such as assigning the same cleaner to a location, using standardized checklists and visual inspections, and maintaining audit scores of 95 % or higher. Together, these three pillars drive higher Net Promoter Scores, stronger client retention and the trust that property managers and business clients expect from a professional cleaning partner.
KPI for Cleaning Staff

Key performance indicators for cleaning staff encompass several measurable dimensions that together reflect reliability, efficiency, safety and client satisfaction.
Attendance and Punctuality – Regular tracking of scheduled vs. actual start times ensures teams arrive on time; a 95% on‑time rate is a common benchmark for high‑performing contractors.
Time‑on‑site and Task Completion Rate – Comparing logged hours to the planned schedule reveals productivity; a first‑time‑fix rate of 90% or higher indicates that tasks are completed correctly without rework.
First‑time‑Fix Rate – This metric captures the percentage of jobs finished correctly on the first visit, directly reducing complaints and boosting repeat‑business.
Inspection Scores and Client‑Satisfaction Surveys – Routine visual audits (e.g., 5‑point checklists) and post‑service CSAT/NPS surveys provide objective quality data; scores above 4.5/5 or NPS > 50 signal strong performance.
Safety Compliance and Incident Rates – Monitoring OSHA‑recordable incidents, near‑misses and adherence to safety protocols protects staff and clients; a goal of fewer than two incidents per 100 jobs is a proven target.
Together, these KPIs give property managers a transparent, data‑driven view of cleaning staff performance, supporting continuous improvement and client trust.
Cleaning Services You Can Offer

Bravo Cleaning delivers a full‑service portfolio tailored to residential managers and business owners. Our routine residential housekeeping covers daily dusting, vacuuming, bathroom and kitchen upkeep, while office janitorial work follows standardized checklists and includes ATP‑tested surface verification. Turnover (move‑in/move‑out) cleaning is executed with a 100‑point inspection, guaranteeing a "cleaned, fresh, uncluttered" environment that boosts tenant satisfaction. We provide carpet and rug care—including stain‑removal success rates above 90 %—and deep‑cleaning of kitchens, bathrooms, and high‑traffic zones using eco‑friendly, low‑VOC products that enhance the "fresh dimension of perceived cleanliness." Customized cleaning plans for apartments and condominiums address specific client needs, from weekly maintenance to seasonal deep cleans, and are reinforced by client testimonials that highlight reliability, attention to detail, and a spotless finish. By integrating digital dashboards, real‑time feedback tools, and consistent staff assignments, we ensure measurable quality, high CSAT scores, and strong retention rates.
How to Measure Client Satisfaction KPI?

Measuring client satisfaction is essential for any cleaning business that wants to retain customers and grow its reputation. The most reliable way to capture this metric is a brief post‑service CSAT survey that asks clients to rate their experience on a 1‑5 scale; calculating the percentage of 4‑ and 5‑star responses gives a clear CSAT score (target ≥ 90 %).
To add a loyalty dimension, send a quarterly Net Promoter Score (NPS) question (“How likely are you to recommend us?” on a 0‑10 scale). An NPS of 50 or higher is considered excellent in the industry and signals strong advocacy.
Track repeat‑business rate by dividing the number of clients who book a second job within 12 months by the total client base; a rate above 80 % indicates high satisfaction.
Aggregate online review ratings from Google, Angi, and BBB, weighting each platform equally to produce an overall rating (aim for 4.5 / 5).
Finally, compile all these data points on a real‑time dashboard with preset thresholds (e.g., CSAT ≥ 90 %, NPS ≥ 50, repeat‑business ≥ 80 %). This visual hub lets managers spot dips quickly, celebrate wins—such as Bravo Cleaning’s 4.6‑star rating—and drive continuous improvement.
By combining short surveys, quarterly NPS, repeat‑business calculations, and online review aggregation, cleaning firms gain a comprehensive, data‑driven view of client satisfaction that fuels retention and growth.
Housekeeping Key Performance Indicators

Effective housekeeping hinges on a set of measurable KPIs that give property managers clear insight into operational health and guest experience.
Room‑turnover time – Faster turnaround (e.g., ≤48 hours for turnover cleaning ) directly boosts occupancy and revenue. Studies show a 22 % reduction in vacancy time when optimized schedules and digital work‑order tools are used.
Cleanliness audit pass rate – Achieving a 95 %+ pass on visual checklists and ATP testing correlates with higher guest satisfaction; facilities that maintain this threshold see a 15 % lift in Net Promoter Scores (NPS > 50).
Guest/tenant satisfaction ratings – Post‑service CSAT surveys (1‑5) and NPS provide actionable feedback. Bravo Cleaning’s 4.6‑star rating and 5‑star reviews illustrate how consistent high scores translate into repeat business and referrals.
Supply and waste efficiency – Tracking green‑product usage and waste reduction not only lowers costs but also improves the “fresh” dimension of perceived cleanliness, raising satisfaction by up to 15 % among eco‑conscious occupants.
Staff absenteeism and training compliance – Low absenteeism (<5 %) and 100 % SOP certification are linked to a 10‑20 % increase in satisfaction scores, as continuity builds trust.
Cost‑per‑occupied‑room and infection‑control compliance – Monitoring cost per occupied room alongside ATP scores (<30 RLU) ensures financial efficiency while meeting health standards; facilities meeting both criteria report a 20 % higher overall satisfaction rating.
By integrating these KPIs into a real‑time dashboard, cleaning teams can quickly address gaps, demonstrate transparency to clients, and sustain the high‑quality, eco‑friendly service that modern property managers demand.
What Is KPI in Cleaning?

A KPI in cleaning is a specific, measurable metric—such as on‑time completion rates, cleanliness inspection scores, client‑satisfaction ratings (CSAT), or safety compliance—that tracks how well a cleaning service meets its quality, efficiency, and reliability goals outlined in Service Level Agreements (SLAs). Common cleaning KPIs include on‑time completion, visual inspection scores (often 5‑point or 100‑point scales), CSAT/NPS surveys, and safety compliance indicators like incident counts. Within SLAs, these KPIs serve as contractual benchmarks that define acceptable performance levels and trigger remediation if targets are missed. By collecting data through digital tools—mobile checklists, GPS tracking, and automated surveys—cleaning firms can turn raw numbers into actionable insights, enabling continuous improvement, transparent client reporting, and evidence‑based adjustments to staffing, training, and eco‑friendly practices.
Cleaning KPI Template

A cleaning KPI template is a structured spreadsheet or software dashboard that captures key performance indicators for a cleaning operation in a single, easy‑to‑read view. The typical column layout includes: KPI name (e.g., client satisfaction score, audit pass rate, response time), Target value (the desired benchmark such as 90 % audit pass), Weekly result (actual performance for the period), Variance (difference between target and result), Responsible staff (the crew member or manager accountable), and Notes/Action items (brief comments on corrective steps or successes).
To enrich quantitative data, add a rating scale (1‑5) column for post‑service surveys and a comment field for qualitative feedback, allowing clients to note specifics like “fresh scent” or “consistent staff.”
Modern cleaning‑management software can automate data capture from digital checklists, ATP tests, and mobile audit tools, populating the template in real time and reducing manual entry errors.
When populated weekly, the template becomes a powerful trend‑spotting tool: variances highlight emerging issues, rating trends reveal satisfaction shifts, and action‑item logs drive continuous improvement cycles that boost client retention and operational efficiency.
Qualities of a Good Cleaning Service

A good cleaning service is built on reliability and punctuality – clients expect cleaners to arrive on schedule and finish jobs within the agreed window. Consistent staffing, with trained professionals who wear identifiable uniforms, reinforces trust and ensures a uniform quality level. Thoroughness is achieved through systematic checklists that cover every surface, equipment, and high‑traffic area, leaving no detail overlooked. Eco‑friendly products and equipment not only reduce chemical exposure but also enhance the "fresh" dimension of perceived cleanliness, resonating with environmentally conscious clients. Flexible, customizable plans let property managers tailor frequency, scope, and special requests for both residential and commercial settings, from turnover cleaning to carpet care. Transparent pricing, full insurance coverage, and a track record of positive testimonials—such as Bravo Cleaning’s 4.6‑star Google rating and repeat‑business rate above 80%—provide the confidence that the service delivers value and reliability. In short, a top‑tier cleaning provider combines punctuality, professional staff, meticulous processes, sustainability, adaptability, and clear, trustworthy communication to exceed client expectations.
How to Use Customer Service Skills in a Cleaning Job

Effective customer service begins with clear communication. Send schedule updates and detailed checklists so property managers know exactly when and how the cleaning will occur. Use professional, positive language in every interaction—address clients by name, confirm their preferences, and express appreciation for their business. Set realistic expectations by outlining what can be achieved in each visit and avoid overpromising; if a task exceeds the standard scope, discuss extra costs or time upfront. When issues arise, respond within the industry‑standard 4‑hour window for non‑emergencies and 2 hours for urgent matters, resolve the problem on‑site if possible, and document the action taken. Follow‑up with a brief post‑service survey or a courteous call to verify satisfaction and capture feedback for continuous improvement. This structured approach builds trust, reduces churn, and positions the cleaning team as reliable partners for residential and commercial clients.
The 5 Levels of Cleanliness

What are the 5 levels of cleanliness?
- Spotless – pristine condition with no visible dust, debris, or odors; matches the highest CSAT scores reported on post‑service surveys (e.g., 5‑star ratings on Angi and Google).
- Very Clean – minor dust or traces of use, yet the environment feels fresh and well‑maintained; aligns with “agree” responses on fuzzy conjoint analysis of food‑premise cleanliness.
- Clean – acceptable for daily use, meeting baseline visual inspection checklists and ATP test thresholds (<30 RLU) used in facilities management.
- Adequate – noticeable dirt but still functional; often yields neutral CSAT scores and may trigger follow‑up actions within the 24‑hour response window recommended for cleaning firms.
- Unclean – significant buildup that raises health or safety concerns; typically generates low NPS and higher complaint rates, prompting immediate remediation. These tiers help property managers benchmark service quality, set expectations, and track improvements through quantitative metrics such as client satisfaction scores, audit results, and eco‑friendly practice adoption.
Turnover Rate in the Cleaning Industry
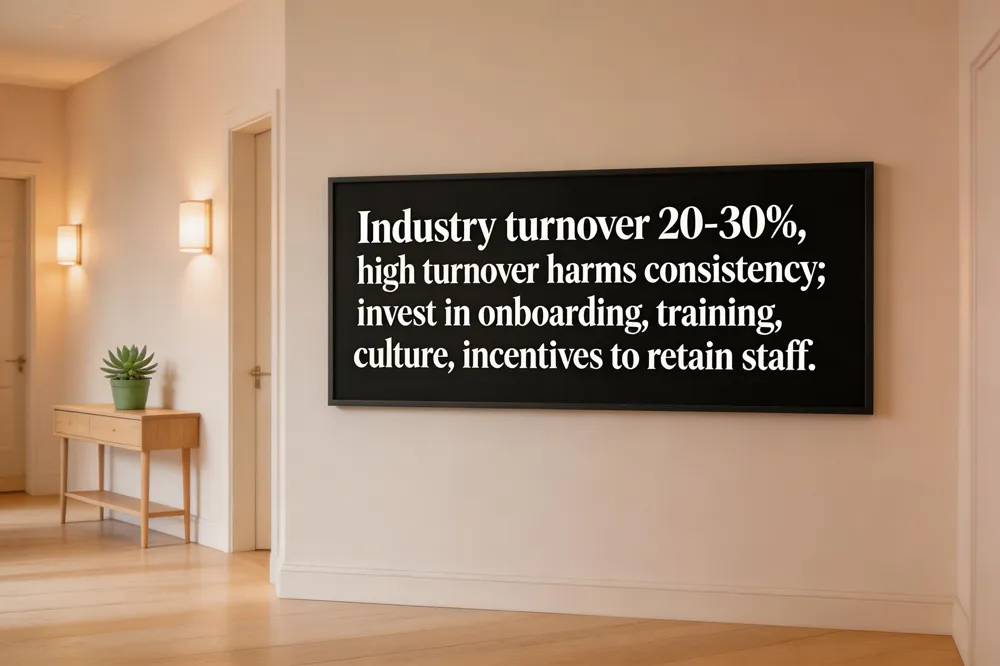
Typical annual turnover in the commercial cleaning sector falls between 20 % and 30 %, with some high‑turnover markets reporting rates up to 40 %. This churn directly threatens service consistency: when staff change frequently, cleaners may miss critical tasks, schedules become fragmented, and client‑facing professionalism suffers, leading to lower satisfaction scores and higher complaint volumes. To curb turnover, firms should invest in comprehensive onboarding and ongoing training that reinforce cleaning standards, eco‑friendly practices, and safety protocols. Building a strong, inclusive workplace culture—through regular team‑building activities, transparent communication, and recognition programs—helps retain talent. Incentive structures such as performance‑based bonuses, clear career‑path ladders, and competitive benefits further reduce attrition. Companies like Bravo Cleaning, which emphasize experienced staff, community roots, and consistent assignment of the same cleaner to a location, report higher repeat‑business rates and stronger client loyalty, illustrating the tangible payoff of a low‑turnover strategy.
The 5 Key Performance Metrics

For cleaning service firms, the five essential performance metrics are: (1) Alignment to strategy – metrics must directly reflect business goals such as client retention, revenue growth, and sustainability. (2) Transparency of methodology – the way data are collected (e.g., post‑service surveys, NPS, visual audits, ATP testing should be openly documented so clients understand the basis of each score. (3) Contextual relevance – metrics are customized to the service type, whether turnover cleaning, carpet care, or daily maintenance, ensuring that the indicators matter to the specific property‑manager or commercial client. (4) Reliability and consistency – tools such as fuzzy conjoint analysis or standardized checklists provide repeatable, statistically sound results (Cronbach’s α > 0.7) that stakeholders can trust. (5) Uniform application over time – regular, scheduled measurement (monthly audits, quarterly surveys) enables trend analysis, benchmarking, and continuous improvement.
Turning Data Into Cleaner Spaces
Bravo Cleaning turns raw performance data into spotless results that property managers can see and trust. By tracking client‑satisfaction scores, Net Promoter Scores, audit pass rates, response‑time metrics, and eco‑friendly product usage, the company identifies strengths and fixes gaps before they affect occupants. Real‑time dashboards and post‑service surveys let customers watch cleanliness trends, while ATP testing and visual checklists verify that every surface meets rigorous standards. The eco‑centric approach—using biodegradable cleaners, low‑VOC solutions, and waste‑reduction reporting—adds a health benefit that clients repeatedly cite in testimonials. Experience the confidence of a cleaning partner that proves its value with measurable, sustainable outcomes. Schedule a free consultation today and see data‑driven cleaning transform spaces.