Turnover Cleaning Efficiency Stats: Time, Labor, and ROI Benchmarks

Understanding the Critical Metrics in Cleaning Operations
The cleaning industry continues to evolve with increasing demands on operational efficiency, labor productivity, and financial performance. This article takes an in-depth look at key benchmarks for employee turnover, cleaning efficiency, time management, labor utilization, and return on investment (ROI) within cleaning services. By assessing relevant data and industry standards, it provides actionable insights for cleaning operations managers aiming to optimize workforce performance, reduce costs, and enhance customer satisfaction. Leveraging advanced analytical methods and KPI frameworks ensures organizations remain competitive and deliver superior service quality in a challenging labor market.
Fundamentals of Cleaning Productivity Measurement

How is cleaning productivity calculated?
Cleaning productivity serves as a vital metric for evaluating the efficiency of cleaning services. It is primarily calculated by dividing the total area cleaned, measured in square feet, by the total direct labor hours spent on cleaning activities. This is expressed as square feet per hour (SF/hour).
The calculation includes various routine cleaning tasks such as trash removal, sweeping, dusting, and cleaning restrooms. However, it typically excludes infrequent or deep cleaning tasks, which are not performed daily. The average productivity rate in the industry tends to hover around 2,500 sq ft per hour, but this can vary based on several factors.
Factors influencing cleaning productivity include building size and layout, the type of industry (e.g., office, healthcare, industrial), staffing levels, and specific customer expectations. To obtain an accurate measurement, managers should comprehensively account for all labor hours dedicated to routine cleaning activities and consider external factors like cleaning equipment and worker skill levels.
Using this calculation allows management to assess current performance, identify areas for improvement, optimize staffing levels, and predict time and cost savings across different cleaning schedules. Benchmarking cleaning productivity against industry standards through research queries such as 'cleaning productivity calculation benchmarks' helps organizations stay competitive and improve service quality.
Key Performance Indicators (KPIs) for Cleaning Efficiency and Workforce Performance
 In the cleaning industry, monitoring performance through specific metrics helps managers understand how well operations are running and where improvements are needed. These metrics, called Key Performance Indicators (KPIs), vary depending on the focus, such as efficiency, customer satisfaction, or workforce management.
Types of KPIs relevant to cleaning operations include productivity measures like tasks completed per hour, and efficiency metrics such as square footage cleaned relative to labor hours. Workforce-specific KPIs involve employee productivity rates, turnover statistics, and safety incident counts. These indicators give insight into both operational outputs and staff stability.
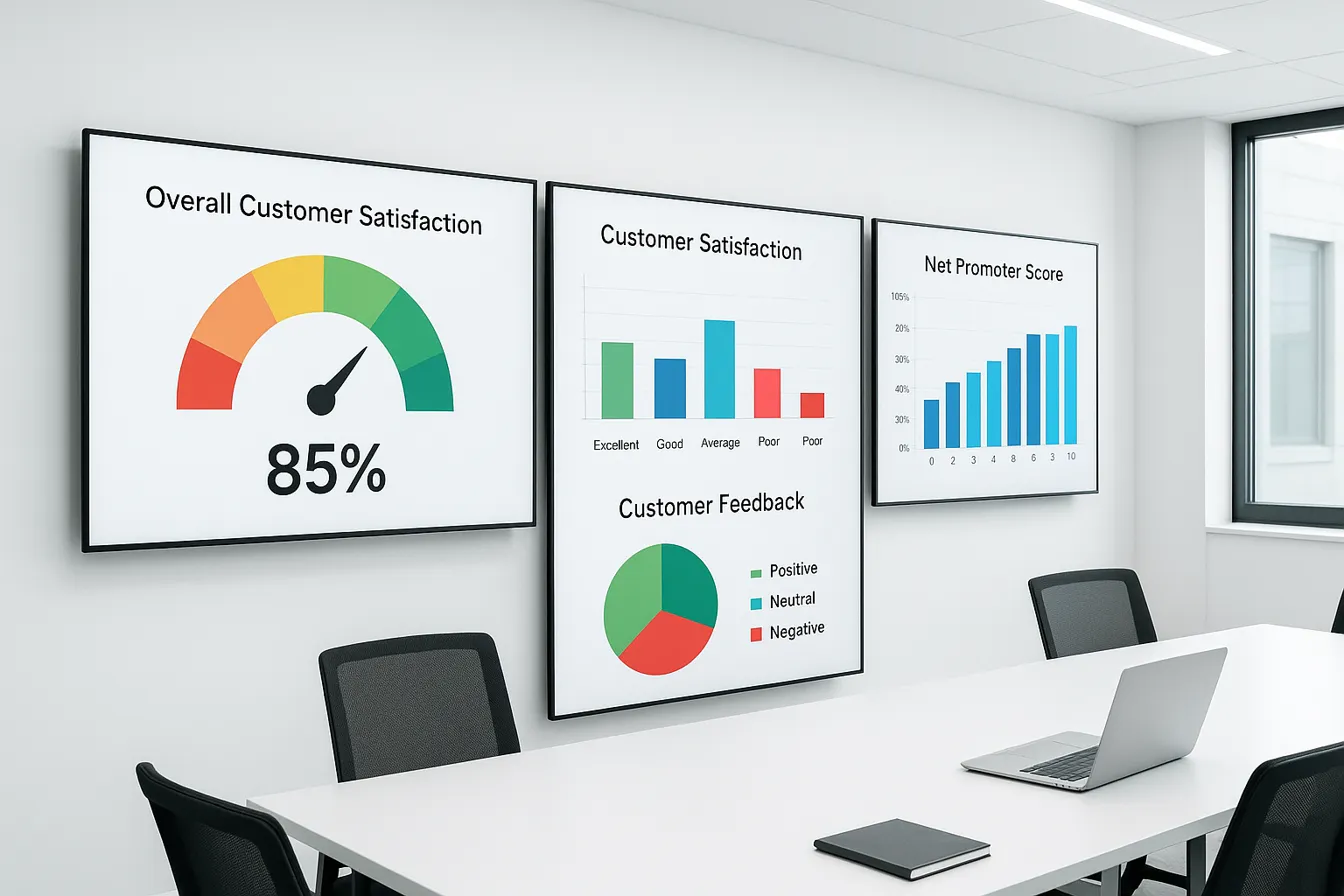
Customer-focused KPIs are crucial, as they reveal how clients perceive service quality. Common metrics include customer satisfaction scores, retention rates, reviews, and appearance assessments. These help gauge the effectiveness of the workforce from the customer’s perspective and identify areas to enhance service delivery.
Operational KPIs also encompass quality audits, safety and health indicators like accident rates, and budget compliance. Responsiveness to client requests and problem resolution times are also measured to assess service agility.
Best practices in KPI selection and monitoring involve setting clear, measurable objectives aligned with organizational goals. Regular review of these metrics ensures they remain relevant, especially as business conditions evolve. Communicating KPIs across departments promotes accountability, while continuous tracking supports data-driven decision-making.
In summary, combining diverse KPIs provides a comprehensive view of cleaning performance. These metrics not only highlight operational strengths and weaknesses but also foster a culture of ongoing improvement, ultimately leading to better client satisfaction, workforce stability, and organizational success.
| KPI Type | Examples | Purpose | Monitoring Frequency |
|---|---|---|---|
| Cleaning efficiency | Tasks per hour, square footage per labor hour | Measure operational productivity | Weekly/Monthly |
| Workforce performance | Employee turnover rate, safety incidents | Assess staff stability and safety | Monthly/Quarterly |
| Customer satisfaction | Satisfaction scores, retention rates, reviews | Evaluate client-perceived service quality | After each service |
| Quality and safety | Audit scores, accident counts | Ensure high standards and a safe environment | Ongoing |
| Financial and responsiveness | Budget adherence, issue resolution time | Maintain financial health and responsiveness | Monthly/Quarterly |
Implementing a balanced set of KPIs helps organizations not only track current performance but also identify opportunities for growth and improvement, supporting long-term success in the cleaning industry.
Understanding Employee Turnover Rates in Cleaning Operations: Industry Benchmarks

What are the industry benchmarks for turnover rates in the cleaning industry?
The cleaning sector, especially within distribution, experiences notably high employee turnover rates. According to the 2023 Cleaning Industry Distribution Benchmarking Survey conducted by ISSA, the industry’s average annual turnover approaches around 75%. In some parts of the industry, particularly in contract cleaning, turnover can escalate dramatically, with rates reaching up to 200% and even 400%.
These high rates reflect difficult staffing conditions and pose significant operational challenges. Frequent employee changes can disrupt service consistency, impact training and onboarding costs, and strain management resources.
Despite these challenges, many cleaning companies have maintained long-standing operations, with a considerable proportion operating for over 25 years. To sustain growth, firms focus on expanding existing client accounts and exploring new channels like e-commerce, which now accounts for approximately 87% of total sales.
Overall, the data indicates that high employee turnover is a persistent characteristic of the cleaning industry, highlighting a crucial need for effective retention strategies to ensure ongoing efficiency and competitive advantage.
| Benchmark | Typical Rate | Context & Notes |
|---|---|---|
| Average annual turnover | 75% | Common in distribution cleaning companies |
| Contract cleaning segments | Up to 200-400% | Reflects extreme attrition |
| Industry longevity | 25+ years | Despite high turnover, firms remain stable |
| Revenue growth strategies | Client expansion & e-commerce | Contribute significantly to sales |
This high employee churn underscores the importance of developing strategic HR practices aimed at reducing turnover and enhancing organizational stability.
Time Management and Labor Utilization Benchmarks in Cleaning Services

What benchmarks exist for time management and labor utilization in cleaning services?
Cleaning service providers rely on specific benchmarks to manage their workforce effectively and ensure optimal productivity. These benchmarks generally include measures such as the average time taken to complete individual tasks, the number of tasks accomplished per labor hour, and overall productivity levels.
Operational efficiency is also gauged by assessing how well routes are optimized to minimize travel time between jobs. This can be tracked by evaluating the percentage of tasks completed as scheduled versus those finished later, which highlights scheduling accuracy.
Labor costs constitute a significant portion of total expenses, so understanding what percentage of operational costs are dedicated to labor helps in setting realistic benchmarks. To gather precise data, many organizations employ digital tools like GPS trackers, time clocks, and mobile apps that monitor work hours and movement.
By comparing these metrics with industry standards—or with facilities like hospitals and care homes—organizations can identify areas needing improvement. Regular review of performance data facilitates better scheduling, staffing adjustments, and resource allocation.
Furthermore, integrating buffer times into schedules, prioritizing tasks based on urgency, and analyzing historical data help optimize workforce utilization. Continual benchmarking and monitoring make it possible to reduce inefficiencies, control costs, and enhance the overall quality of cleaning services.
Evaluating Return on Investment (ROI) in Cleaning and Workforce Management

How can return on investment (ROI) be evaluated in cleaning processes and workforce management?
Assessing ROI in the cleaning industry involves a combination of financial analysis and qualitative evaluation of benefits. One common approach is to calculate the financial gains obtained through enhancements in operational efficiency, employee productivity, and customer satisfaction.
Efficient cleaning processes can lead to tangible cost savings. For example, reducing labor overtime, decreasing employee turnover, and minimizing sick leave all result in lower expenses. Similarly, investing in staff training can boost productivity, leading to faster job completion and higher revenue generation.
To measure ROI, organizations typically use the standard formula:
ROI = (Net Gain from Investment) / (Cost of Investment)
In this context, the benefits can include savings on labor and maintenance costs, or increased revenue from improved customer perceptions. The costs encompass investments in cleaning equipment, employee training, or new management strategies.
Additionally, the Benefit Cost Ratio (BCR) offers insights into the efficiency of investments in workforce management. A BCR above 1 indicates that benefits outweigh costs.
Qualitative advantages also play a role. Enhanced customer satisfaction due to cleaner environments can lead to repeat business and positive brand reputation. Similarly, improved employee morale and retention contribute to stable operations and continued productivity.
By combining these methods—quantitative financial metrics and qualitative improvements—companies gain a comprehensive understanding of ROI. This multi-faceted evaluation supports strategic decision-making, ensuring that investments in cleaning and workforce initiatives deliver maximum value and sustainable growth.
Analyzing the Relationship Between Employee Turnover and Labor Productivity
What are the current industry trends regarding workforce turnover and productivity in cleaning operations?
In the cleaning industry, workforce turnover remains a prevalent issue. High turnover rates are often caused by labor shortages, low job satisfaction, and increasing wage expectations. To combat these challenges, many companies are implementing strategies such as comprehensive training programs, opportunities for career progression, employee recognition initiatives, and improved benefits packages to retain staff.
Technology integration is also becoming common. Tools like automation, IoT devices, and advanced management software help streamline operations and reduce reliance on manual labor, thus supporting productivity even when workforce challenges persist.
In-house cleaning teams, typically benefiting from better job security and benefits, tend to have lower turnover rates than contracted cleaning services, which often face greater staffing instability.
Addressing these workforce issues is crucial. Innovative hiring practices, including the use of visa programs and other recruitment avenues, along with effective workforce management, are key to maintaining consistent productivity levels and supporting the industry's growth.
How does employee turnover impact labor productivity?
Research shows a complex relationship between employee turnover and labor productivity. It follows a non-linear, inverted-U shape. Initially, small increases in turnover can lead to productivity gains, as replacing less engaged employees can bring in fresh energy and ideas.
However, beyond an optimal point—around a 9% turnover rate—productivity begins to decline. When turnover surpasses approximately 22.4%, the negative effects become more pronounced, with productivity falling significantly.
Turnover volatility, or frequent fluctuating rates of employee departures over time, also impacts productivity negatively. High turbulence makes it difficult to develop effective routines and maintain efficiency, exacerbating productivity losses.
What is the optimal turnover rate for boosting labor productivity?
Based on longitudinal data from Belgian firms over ten years, the ideal turnover rate appears to be around 9%. At this level, organizations experience about a 5.3% productivity increase compared to having no turnover.
Beyond this point, as turnover increases further, productivity declines sharply. Maintaining stable, low turnover levels is therefore critical for maximizing operational efficiency and return on investment.
How do turnover patterns influence organizational routines?
Organizational routines, the established ways of conducting work, are vital for consistent productivity. High turnover and volatility hamper routine development, creating inefficiencies and disrupting service quality.
Organizations need to focus on stability and retention to develop robust routines, which in turn help buffer the adverse effects of employee departures.
| Aspect | Impact | Suggestions |
|---|---|---|
| Turnover Rate | Non-linear; optimal ~9% | Focus on retention strategies |
| Turnover Volatility | Negative impact | Maintain stable staffing levels |
| Productivity Gains | Up to 5.3% at 9% turnover | Manage turnover around this target |
| Risks of High Turnover | Efficiency loss, poor routines | Invest in employee engagement and HR policies |
Understanding and managing these dynamics is essential for cleaning service providers aiming to keep productivity high and operational costs low.
Turnover Volatility: Implications for Cleaning Operation Stability and Efficiency
What is turnover volatility, and how does it affect cleaning operations?
Turnover volatility refers to the fluctuations in employee turnover rates over time within a cleaning company or service team. High volatility indicates frequent and unpredictable changes in staffing levels, creating instability. This volatility can make it harder for management to plan and maintain consistent service quality.
In cleaning operations, significant turnover or rapid changes in staffing can lead to disruptions, affecting scheduling, training, and overall productivity. The research confirms that when turnover fluctuates wildly, it hampers the ability to develop effective routines, leading to inefficiencies and a decline in service quality.
How does turnover volatility impact organizational routines?
Organizational routines are the established procedures and practices that enable smooth and efficient service delivery. When turnover is stable and low, these routines are easier to develop, refine, and maintain.
However, high volatility reduces the organization’s capacity to build routines, resulting in less consistency in cleaning quality. The study finds that such disruptions often cause efficiency losses, negatively impacting overall operational performance and return on investment.
What strategies can help mitigate losses caused by turnover volatility?
To counteract the adverse effects of turnover fluctuations, cleaning companies should focus on strategies that promote workforce stability. These include:
- Implementing effective employee retention programs.
- Offering competitive wages and benefits.
- Creating a positive work environment to enhance job satisfaction.
- Providing ongoing training and career development.
By maintaining a steady and committed staff, organizations can foster routines that support consistent service quality and operational efficiency. The research highlights that stable staffing not only improves productivity but also enhances overall profitability.
Statistical Approaches to Measuring Turnover and Cleaning Efficiency
Understanding and improving organizational performance in cleaning services involves applying various statistical and analytical methods to assess employee turnover and operational efficiency.
One widely utilized approach in turnover studies is polynomial regression. This method helps reveal the complex, non-linear relationship between employee turnover rates and labor productivity. For example, research has shown an inverted-U-shaped curve, indicating that productivity initially improves with low turnover, reaches a peak at around 9% turnover, and then declines beyond approximately 22.4%. Furthermore, the variability or volatility in turnover—how much turnover fluctuates over time—negatively impacts productivity, complicating the relationship further.
To measure cleaning efficiency, organizations often employ process control methods such as time-motion studies and statistical process control (SPC). These techniques analyze how quickly and effectively teams complete cleaning tasks. Metrics like turnover time, defect rates (e.g., missed spots or re-cleanings), and staff productivity are tracked constantly, often with electronic monitoring tools or sensors that provide real-time data.
Benchmarking with longitudinal data is another critical strategy. By analyzing 10-year datasets from Belgian firms, for example, companies can compare their performance against industry standards, identifying trends and areas for improvement over time.
Combining these methods provides a comprehensive view:
| Method/Framework | Purpose | Data Source/Tools | Benefits |
|---|---|---|---|
| Polynomial Regression | Identify non-linear effects of turnover on productivity | Statistical software, historical data | Shows optimal turnover levels and potential productivity gains |
| Time-motion Studies | Measure cleaning speed and effectiveness | Video recordings, manual observations | Pinpoints bottlenecks, improves processes |
| Statistical Process Control | Monitor consistency of cleaning operations | Sensors, checklists | Ensures quality, detects variability in real-time |
| Benchmarking & Longitudinal Analysis | Compare performance over time and against peers | Industry data, company records | Drives strategic improvements, sets realistic targets |
These analytical approaches support data-driven decision-making, enabling managers to identify root causes of inefficiencies, optimize resource allocation, and develop effective retention strategies. However, they also require ongoing data collection and careful interpretation to avoid pitfalls such as data manipulation or misaligned incentives.
Customer Metrics as Indicators of Cleaning Workforce Effectiveness
How does customer satisfaction influence retention and referrals?
Customer satisfaction is a crucial measure of how happy clients are with a cleaning service. When customers are pleased with the quality and consistency of cleaning, they are more likely to become repeat clients and recommend the service to others. High satisfaction scores often lead to increased word-of-mouth referrals, helping to grow the business organically.
Why is customer retention an important performance indicator?
Customer retention rate reflects the percentage of clients who continue using the cleaning service over time. A high retention rate indicates strong customer loyalty, which typically results from consistent service quality and positive customer experiences. Retained customers are valuable because they generate steady revenue and often require less marketing effort to keep.
What is the connection between service quality and workforce efficiency?
The quality of cleaning services directly ties to the performance of the cleaning workforce. Well-trained, motivated employees tend to deliver higher service standards, boosting customer satisfaction. Conversely, issues like employee turnover can disrupt routines and degrade service quality, negatively affecting customer perception and loyalty. Maintaining a skilled and stable staff ensures that operational efficiency translates into high customer satisfaction, which in turn sustains business growth.
Financial Health Indicators in Cleaning Operations: Beyond Basic Metrics
Net Profit Margin as a Health Benchmark
The net profit margin is a vital financial metric that shows what percentage of revenue remains after covering all expenses. For cleaning companies, a healthy net profit margin indicates effective cost management and strong profitability. It helps gauge whether operations are sustainable in the long run.
Revenue per Client Analysis
Average revenue per client is a useful indicator of revenue growth potential. By dividing total revenue by the number of clients, companies can identify high-value clients and tailor services accordingly. Monitoring this metric over time reveals trends and highlights opportunities for upselling or improving service efficiency.
Integration of Financial and Operational KPIs
Financial metrics like net profit margin and revenue per client are most insightful when combined with operational KPIs such as cleaning efficiency and employee turnover rate. This integrated approach provides a comprehensive view of both financial health and day-to-day operational performance.
Broader Industry Context
In the cleaning services industry, maintaining a balance between profitability and operational excellence is essential. Leveraging a mix of KPIs helps management make informed decisions, optimize resource allocation, and enhance overall service quality. Regular review and adaptation of these indicators ensure continuous improvement aligned with strategic goals.
Strategies to Improve Workforce Retention and Stability in Cleaning Services
How can effective HR and retention policies support cleaning companies?
Implementing strong human resources (HR) policies focused on employee well-being, recognition, and development can significantly improve retention rates. Clear communication about job expectations, fair compensation, and opportunities for career advancement encourage employees to stay longer. Creating a positive work environment reduces turnover and fosters loyalty, which directly impacts service consistency and customer satisfaction.
Why are training and career development important?
Offering ongoing training and development programs equips cleaning staff with the necessary skills and confidence. When employees see opportunities for growth, they tend to be more engaged and committed. This not only improves service quality but also helps build a stable workforce. Regular skill upgrades and clear career pathways reduce the likelihood of turnover, contributing to operational efficiency.
What benefits does low and stable turnover bring to ROI?
Maintaining a low turnover rate, around 9% as indicated by research, can boost labor productivity by approximately 5.3%. Stable staffing allows for the development of effective routines, which enhances cleaning efficiency and service quality. In turn, consistent delivery of high-quality service improves customer satisfaction, leading to higher retention and referrals. Overall, stable employment positively influences the return on investment by reducing training costs and increasing operational stability.
| Aspect | Impact | Additional Details |
|---|---|---|
| Employee retention | Higher productivity, better service | Reduces recruitment and training expenses |
| Training programs | Skill enhancement, engagement | Promotes career growth and satisfaction |
| Turnover rate | Affects ROI | Optimal around 9%, negative impact beyond 22.4% |
| Organizational routines | Efficiency and consistency | Better routines with low turnover improve service quality |
Focusing on strategic HR practices, continuous training, and maintaining low turnover can significantly enhance the overall performance and profitability of cleaning service companies.
Technological Innovations Supporting Cleaning Efficiency and Labor Management
How does the use of automation and IoT improve cleaning efficiency?
Automation and the Internet of Things (IoT) have transformed the cleaning industry by enabling faster and more accurate service delivery. Automated cleaning devices, such as robotic vacuum cleaners and floor scrubbers, handle routine tasks with minimal human intervention, freeing up staff for more complex jobs. IoT devices enhance operational oversight by providing real-time data on equipment status, cleaning progress, and environmental conditions, allowing teams to respond swiftly to changing needs.
This technology integration boosts efficiency by reducing time spent on manual observations and adjustments, ultimately increasing the volume of work completed within a given timeframe. It also helps identify maintenance issues early, preventing downtime and maintaining consistent service quality.
How is AI being adopted for scheduling and monitoring?
Artificial Intelligence (AI) is revolutionizing scheduling and workforce monitoring in the cleaning sector. AI-driven scheduling tools analyze data points such as staff availability, job complexity, and location logistics to optimize work assignments. This results in more efficient routes, reduced idle time, and better resource allocation.
Furthermore, AI systems continuously monitor performance metrics and cleanliness standards through sensors and cameras, alerting supervisors to any deviations. This proactive approach ensures high standards are maintained and enhances accountability, leading to improved customer satisfaction and retention.
What role does management software play in reducing turnover impact?
Advanced management software simplifies employee scheduling, communication, and training, creating a better work environment. By providing clear expectations and streamlined processes, these tools help reduce job frustration and burnout, which are common drivers of employee turnover.
Moreover, analytics within management platforms can identify patterns in staff movement and satisfaction, enabling managers to implement targeted retention strategies. When turnover is low, companies experience more stable routines and better overall productivity, directly contributing to improved operational and financial performance.
Linking Cleaning Efficiency to Health Outcomes: Benchmark Data Insights
Cleaning practices significantly influence both the operational efficiency of cleaning services and the health outcomes of the facilities they serve. Benchmark data highlights that adopting structured cleaning routines boosts efficiency by reducing the time and labor needed for cleaning tasks, all while maintaining high-quality standards.
In healthcare environments, specific cleaning strategies—such as staff training, real-time monitoring, and feedback systems—have proven crucial. These measures have led to a remarkable 75% reduction in healthcare-associated infections (HAIs), demonstrating the strong link between effective cleaning and infection control. Additionally, the use of advanced cleaning agents tailored to surface materials and innovative disinfection technologies like UV-C light enhances overall efficacy.
Case studies from various facilities show that improvements in cleaning procedures directly correlate with fewer infections, better patient outcomes, and increased safety compliance. For instance, hospitals implementing tracking systems to monitor cleaning performance saw sustained improvements, which translated into better health metrics and shorter hospital stays.
Overall, benchmark data underscores that investing in optimized cleaning practices benefits operational performance and promotes healthier environments. Facilities that focus on cleaning efficiency not only cut costs but also foster safer, healthier spaces that support recovery and well-being.
Benchmarking Best Practices for Operational Efficiency in Cleaning Services
What are the benchmarks for operational throughput?
Operational throughput refers to how much work a cleaning team can complete within a certain period. To gauge performance, companies often look at industry standards and internal data to set realistic goals. For example, measuring the average cleaning time per room or per square foot and comparing it against top-performing companies helps identify efficiency gaps.
Establishing clear throughput benchmarks encourages continuous improvement. Regularly tracking these metrics ensures teams meet service deadlines effectively and use resources optimally.
How can safety and quality metrics be incorporated?
Maintaining high safety and quality standards is essential in the cleaning industry. Key metrics include the number of safety incidents and customer complaint rates. Benchmarking these figures against industry averages aids in understanding where safety protocols and training need strengthening.
Quality can be measured through customer satisfaction scores and re-cleaning rates. Regular assessment of these indicators helps maintain high service standards, and comparing them to industry leaders drives ongoing quality improvements.
How to set achievable targets based on industry data?
Effective targets are rooted in accurate, industry-specific benchmarks. Analyzing data from trusted sources provides a realistic picture of what is attainable, considering current economic and operational conditions.
By combining data on throughput, safety, and quality, companies can establish SMART (Specific, Measurable, Achievable, Relevant, Time-bound) goals. These targets motivate staff, improve operational efficiency, and enhance overall ROI.
| Benchmark Type | Typical Industry Range | Significance | Example Metrics |
|---|---|---|---|
| Operational Throughput | Varies by service size | Measure efficiency | Rooms cleaned per hour |
| Safety Incidents | Less than 2% of workforce | Ensure safety standards | Number of accidents per month |
| Customer Satisfaction | 80-95% positive ratings | Gauge customer loyalty | Satisfaction scores from surveys |
Optimizing these aspects ensures the cleaning company remains competitive, efficient, and committed to quality, ultimately boosting profitability and customer retention.
Impact of Employee Engagement and Safety on Cleaning Productivity
How does employee engagement influence turnover?
Employee engagement plays a crucial role in retaining staff in cleaning services. Engaged employees tend to feel more connected to their work and the organization, leading to higher job satisfaction and loyalty. When employees are motivated and committed, the likelihood of turnover decreases. Conversely, low engagement often results in higher turnover rates, disrupting routine operations and increasing recruitment and training costs.
Research indicates that a positive work environment, recognition, and opportunities for growth boost employee engagement, which in turn stabilizes the workforce. Stable staffing levels ensure consistent cleaning quality and operational efficiency.
What effect do safety incidents have on workforce productivity?
Safety is a vital aspect of the cleaning industry. Incidents such as slips, trips, or exposure to harmful chemicals can significantly impact productivity. Not only do safety incidents cause physical harm and morale issues among staff, but they also lead to increased absences and lower overall efficiency.
Organizations with robust safety protocols tend to see improved workforce performance. A safe work environment cultivates trust and reduces the number of disruptions caused by accidents. It also encourages employees to follow safety procedures more diligently, enhancing overall effectiveness.
How can companies foster a safe and motivated workforce?
Creating a safe and motivating workplace involves several strategic actions:
- Implement comprehensive safety training programs that are regularly updated.
- Foster open communication where employees feel comfortable reporting hazards.
- Recognize and reward employees who adhere to safety standards.
- Promote engagement by involving staff in decision-making and providing clear career development paths.
- Encourage teamwork and a supportive work culture to boost morale.
By prioritizing both safety and employee motivation, cleaning companies can reduce turnover, minimize costly safety incidents, and improve overall productivity, leading to better service delivery and higher customer satisfaction.
Role of Organizational Routines in Mitigating Turnover Effects
How routines buffer productivity losses
Organizational routines are established patterns of behavior that help maintain consistency in work processes. In cleaning services, these routines ensure that tasks are completed efficiently and uniformly, which supports high cleaning efficiency. When employee turnover is low, routines become well ingrained, leading to smoother operations and sustained productivity. This stability helps prevent sudden drops in service quality, fostering customer satisfaction and retention.
Impact of routine disruption from turnover volatility
High turnover volatility can significantly disrupt organizational routines. Frequent changes in staff hinder the development of effective routines, which can cause inefficiencies and reduce overall cleaning efficiency. The research indicates that turbulence in turnover negatively affects labor productivity, as organizations struggle to maintain consistent routines amid constant staffing changes. Such disruptions lead to increased errors, longer cycle times, and potentially higher operational costs.
Best practices for sustaining effective organizational routines
To mitigate the negative effects of turnover, companies should focus on developing resilient routines that can withstand staff fluctuations. This includes detailed documentation of procedures, cross-training employees, and fostering a culture of continuous learning. Maintaining stable staffing levels and implementing strategic HR policies aimed at retention can also protect routines. Regular review and adaptation of routines ensure they remain relevant, helping organizations sustain high productivity and improve overall ROI.
Financial and Operational Integration: Using KPIs to Drive Decision Making
How do KPIs help align financial and operational goals?
Key Performance Indicators (KPIs) serve as vital tools that bridge the gap between financial outcomes and operational performance. In cleaning services, KPIs such as net profit margin and average revenue per client offer insights into financial health. Concurrently, operational metrics like cleaning efficiency and employee turnover rates reveal the effectiveness of daily processes.
By monitoring these indicators together, managers can identify if operational practices are contributing to financial targets. For example, improving cleaning efficiency may increase the number of jobs completed, boosting revenue, while managing employee turnover can stabilize service quality critical for customer satisfaction.
What is the role of KPIs in enabling data-driven management?
KPIs support managers in making informed decisions by providing measurable data. They facilitate the assessment of progress toward strategic goals, such as customer satisfaction and retention or operational capacity. In the cleaning industry, tracking customer satisfaction scores assists managers in addressing service issues quickly, preventing customer loss.
Moreover, KPI analysis highlights areas needing improvement, such as reducing turnover volatility to enhance labor productivity. This data-driven approach fosters accountability and ensures resources are allocated effectively to maximize profitability and service quality.
How can continuous KPI review promote ongoing improvement?
Regular review of KPIs ensures that business strategies remain aligned with evolving market conditions. As the cleaning industry changes, certain metrics may lose relevance or require recalibration. For instance, maintaining an optimal turnover rate around 9% can be reassessed periodically to adapt to staff dynamics.
Ongoing KPI evaluation encourages a culture of continuous improvement, allowing companies to respond swiftly to performance gaps. This proactive approach helps sustain growth, improve efficiency, and strengthen competitive advantage in the long term.
| KPI Category | Example Metric | Purpose | Additional Notes |
|---|---|---|---|
| Financial | Net profit margin, revenue | Measure profitability and financial health | Critical for overall financial decision making |
| Customer | Satisfaction score, retention rate | Gauge customer happiness and loyalty | Drive service quality improvements |
| Process | Cleaning efficiency, cycle time | Track operational productivity and turnaround times | Influence operational capacity |
| HR | Employee turnover rate, volatility | Assess workforce stability and impact on productivity | Connects staff stability to service quality |
Effective integration of financial and operational KPIs, combined with regular reviews, empowers cleaning companies to stay competitive, adapt strategies swiftly, and ensure continuous performance enhancement.
Competitive Advantages of Stable, Efficient Cleaning Workforce Models
Benefits of Reduced Turnover for Client Satisfaction
A stable cleaning workforce directly enhances customer satisfaction. When employees stay longer, they become more familiar with client preferences and the specific needs of each space. This familiarity leads to higher-quality service, greater consistency, and a more personalized experience for clients.
Repeated positive interactions increase customer loyalty and boost the likelihood of repeat business and referrals. Lower turnover also reduces service disruptions caused by staff changes, ensuring that clients enjoy seamless and reliable cleaning services.
Efficiency Gains and Cost Savings
Maintaining a consistent team improves cleaning efficiency. Experienced employees complete jobs faster and with greater accuracy, reducing operational time and labor costs. This efficiency allows companies to take on more clients without sacrificing quality.
In addition, lower turnover reduces expenses associated with recruiting, training, and onboarding new staff frequently. These savings contribute to healthier profit margins and can be reinvested into improving service quality or expanding service offerings.
Sustainability and Workforce Continuity
A stable workforce supports long-term growth and sustainability. When employees remain with the company longer, they develop deeper skills and a stronger understanding of organizational routines, leading to a more resilient operation.
High workforce stability also encourages a positive workplace culture, increasing employee engagement and reducing turnover volatility. This continuity helps build a reliable reputation, attracts quality workers, and sustains performance levels over time.
| Aspect | Benefit | Additional Details |
|---|---|---|
| Customer Satisfaction | Improved service consistency | Familiar staff better meet client needs |
| Cost Efficiency | Reduced recruitment and training costs | Faster job completion and fewer errors |
| Workforce Sustainability | Long-term operational stability | Stronger routines and organizational resilience |
These benefits emphasize that fostering a stable, efficient workforce in the cleaning industry not only improves client satisfaction but also contributes significantly to operational efficiency and business longevity.
Implementing Data Collection Tools for Real-Time Efficiency Tracking
Electronic Monitoring Systems
Electronic monitoring systems are increasingly used in cleaning services to track team performance and operational efficiency. These tools provide real-time data on work progress, allowing managers to quickly identify bottlenecks or underperformance. By automating data collection, companies can reduce manual errors and improve the accuracy of their efficiency assessments.
Sensor Technology and Mobile Applications
Advancements in sensor technology and mobile apps have made it easier to gather detailed information on cleaning processes. Sensors installed on equipment or in cleaning supplies can monitor usage and time spent, while mobile applications enable staff to record task completion and troubleshoot issues on the spot. These innovations support a proactive approach to maintenance and quality control.
Enhancing Accuracy and Accountability
Real-time data collection significantly improves the accuracy of performance metrics and enhances accountability within teams. When employees know their actions are monitored continuously, it encourages adherence to standards and reduces the likelihood of errors. Moreover, data transparency helps management make informed decisions, optimize workflows, and boost overall cleaning efficiency.
Emerging Trends: The Future of Workforce and Efficiency in Cleaning Operations
How are shifts in labor market dynamics affecting cleaning companies?
The cleaning industry, like many others, is experiencing changes in labor market dynamics that significantly influence operational performance. A key aspect of these shifts is the fluctuation in employee turnover rates. Research highlights a complex relationship where moderate employee turnover can boost labor productivity, but excessive or highly volatile turnover hampers efficiency and reduces overall ROI. Maintaining turnover around 9% appears optimal, balancing fresh ideas with stability.
What innovations in workforce management are shaping the cleaning sector?
Advancements in technology and management practices are transforming how cleaning companies oversee their workforce. The adoption of real-time KPIs, such as cleaning efficiency and error rates, helps managers monitor performance closely. These metrics enable companies to optimize staff deployment, reduce error rates, and improve service quality.
Moreover, strategic HR policies aimed at reducing turnover volatility are essential. Stability in employee retention not only enhances routine development but also leads to higher productivity and better customer satisfaction, all of which influence financial metrics like net profit margin and average revenue per client.
What is the predicted impact on turnover and ROI?
Staying ahead with innovative management and workforce strategies is expected to yield positive impacts on turnover rates and ROI. Stable employment levels foster the development of effective organizational routines, minimizing efficiency losses caused by frequent staffing changes.
The research underscores that these improvements can lead to a roughly 5.3% increase in labor productivity compared to scenarios with no turnover, emphasizing the importance of strategic retention efforts. Conversely, high volatility in employee churn—often seen with rapid, unplanned staffing changes—can suppress productivity gains and negatively impact profitability.
In summary, focusing on balanced turnover rates, implementing data-driven KPIs, and fostering workforce stability are critical steps toward enhancing operational efficiency and maximizing return on investment in future cleaning industry practices.
Case Study Highlights: Successful Application of Efficiency and Turnover Benchmarks
How can companies improve ROI through turnover management?
Managing employee turnover effectively can significantly boost return on investment (ROI). A study of Belgian firms over ten years revealed an optimal turnover rate around 9%. Maintaining this level of staff stability was associated with a 5.3% increase in productivity. When turnover stays within this range, companies experience smoother operations and lower recruitment costs, leading to better profitability.
Conversely, high turnover rates—beyond approximately 22.4%—are linked to declines in productivity. Excessive employee departures can disrupt routines and increase training expenses. Strategies that focus on retaining skilled employees, such as improved work conditions and targeted incentives, help sustain a stable workforce capable of generating higher ROI.
How do KPIs drive improvements in cleaning efficiency?
Implementing key performance indicators (KPIs) is vital for boosting cleaning efficiency. Metrics like average cleaning time, error rates, and customer satisfaction scores enable management to monitor and optimize operations. For instance, tracking cleaning cycle times helps identify bottlenecks and streamline workflows.
Regular evaluation of these KPIs encourages teams to adopt best practices and align efforts with organizational goals. As a result, cleaning tasks are completed more quickly and effectively, increasing operational capacity and revenue. Moreover, transparency in KPI reporting fosters accountability and continuous improvement across teams.
What lessons can industry leaders share about turnover and efficiency?
Industry leaders emphasize that stability in staffing and measurable performance are central to sustained success. Establishing clear routines and routines buffers can mitigate the adverse effects of turnover volatility. Firms that develop organizational routines adaptable to changing conditions tend to maintain higher efficiency levels.
Additionally, a focus on strategic HR policies that aim to reduce turnover, especially volatility, supports long-term productivity gains. Regularly reviewing and updating KPIs ensures they remain relevant, helping organizations respond swiftly to evolving business environments. The integration of data-driven decision-making and consistent routine development are crucial lessons from top performers in the cleaning industry.
Optimizing Cleaning Operations Through Informed Benchmarking
Effectively managing turnover, labor utilization, and cleaning efficiency is critical to maximizing ROI in cleaning operations. By leveraging robust KPIs and embracing advanced analytical methods, organizations gain clear insights into their workforce performance and operational health. Industry benchmarks provide valuable guidance for setting realistic goals and implementing best practices that reduce costs, boost productivity, and improve customer satisfaction. As workforce dynamics and technologies continue to evolve, proactive adoption of data-driven management strategies will be essential for maintaining competitive advantage and delivering high-quality cleaning services. Ultimately, stable, engaged workforces combined with efficient process management lead to sustained financial and operational success in this demanding sector.
References
- Top KPIs Every Cleaning Business Owner Should Know
- KPIs: What Are Key Performance Indicators? Types and Examples
- (PDF) The impact of employee turnover and turnover volatility on ...
- The 2023 Cleaning Industry Distribution Benchmarking Survey - ISSA
- Top 10 Time Management Tips for Your Cleaning Business Service
- Cleaning productivity benchmarks | Rubbermaid Commercial | R
- 15 Time Tracking Tips For Cleaning Companies To Boost ...
- Environmental cleaning and disinfection: Sustaining changed ...
- Surface Materials and Cleaning Efficacy in Healthcare
- The Impact of Cleaning on Patient Satisfaction - Contec Professional


